
Punjab is on top of the COVID safety index as of 5th July. Telangana has reached to bottom with 80.68%. The full index as of the 5th July has been given later in this article. We shall be updating the COVID Safety Index daily. Keep visiting to see it! Bookmark the URL!
The comparison of the states based on the total number of cases or/and tests per million is widely being made on social media and TV news. All states are being compared without giving importance to their population and geographical area. When we compare states which consist of Delhi, based on the absolute number of COVID cases, we do injustice to the highly populated states like UP. Similarly, when we compare states just based on tests per million, we also do not fair with states like Odisha that are low on economic resources, especially testing capability in comparison to states like Kerala. Odisha can never test at the same rate as Delhi. We usually calculate the recovery rate as the ratio of total recovered patients to total confirmed cases till that day. It is almost impossible for any patient to recover on the same day he/she has been confirmed as COVID cases.
Therefore, the usual calculation of the recovery rate doesn’t do well for seeing the real picture.
In light of the above, we look for parameters related to COVID cases, which can be used irrespective of population, testing capability, geographical area to compare Indian states. We look at such parameters that are readily available and not too complex to understand. We will not include data of states having less than 100 cases to limit the error due to the lack of data. First, the “percentage of COVID test turning negative” can give us the idea of how much the population of a particular country is safe from COVID irrespective of the testing rate. In doing this, we assume that even if every person(if a country has enough resources) is tested, at least this much % of people will turn negative. Second, “Adjusted Recovery Rate(ARR),” which we calculate as the ratio of total recovered people on a day to total confirmed cases in that country 14days back. Usually, COVID cases are confirmed with 1-14 days of delays from actual infection, and it takes about 14-28 days for a person to recover from the COVID from the exact infection date. Therefore, we decided to consider 14 days. We caution that ARR for few states could be more than 100% as recorded data talk about days of confirmed cases, not actual days of infection. So patients can recover earlier than 14 days from the confirmed date. The ARR beautifully takes care of the death rate without talking about death. The HIGH ARR also indicates better health care facilities and preparedness to tackle COVID patients in a particular state.
Since the measure of transmission of COVID in the population of a region is very significant, we assign 95% weightage to “percentage of COVID test turning negative” and 5% weightage to “Adjusted Recovery Rate” in the calculation of COVID SAFETY INDEX for Indian states. The selection of 95% & 5% weightage is not random; it is based on the fact that about 5% of tests conducted across India have been found positive.
LIVE UPDATE: COVID Safety Index as on 5th July
We shall be using 93%&7% as the weight to calculate COVID Safety index as the positivity rate for India has increased to 7%.
We shall be using 93%&7% as the weight to calculate COVID Safety index as the positivity rate for India has increased to 7%.

UPDATE: COVID Safety Index as on 13th June
We shall be using 94%&6% as the weight to calculate COVID Safety index as the positivity rate for India has gone above 6%.
We shall be using 94%&6% as the weight to calculate COVID Safety index as the positivity rate for India has gone above 6%.


UPDATE: COVID Safety Index as on 10th June
We shall be using 94%&6% as the weight to calculate COVID Safety index as the positivity rate for India has gone above 5%.

LIVE UPDATE: COVID Safety Index as on 7th June
We shall be using 94%&6% as the weight to calculate COVID Safety index as the positivity rate for India has gone above 5%.
We shall be using 94%&6% as the weight to calculate COVID Safety index as the positivity rate for India has gone above 5%.

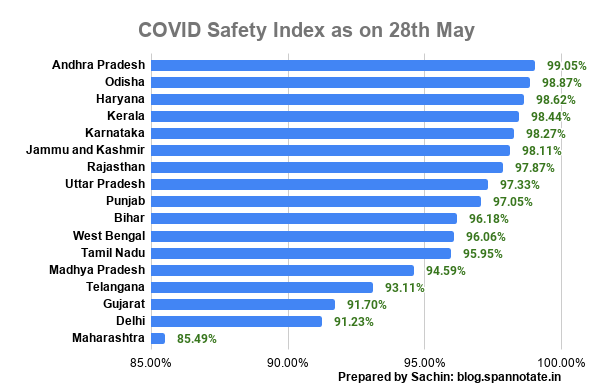
UPDATE: COVID Safety Index as on 28th May
We shall be comparing states with 1000 or more cases. We shall be using 95%&5% as the weight to calculate COVID Safety index as the positivity rate for India has gone above 4%.
UPDATE: COVID Safety Index as on 24th May
We shall be comparing states with 500 or more cases. We shall be using 95%&5% as the weight to calculate COVID Safety index as the positivity rate for India has gone above 4%.

UPDATE: COVID Safety Index as on 18th May
We shall be comparing states with 500 or more cases. We shall be using 96%&4% as the weight to calculate COVID Safety index 2nd may onwards as positivity rate for India has fallen below 4%.

We shall be comparing states with 200 or more cases. We shall be using 96%&4% as the weight to calculate COVID Safety index 2nd may onwards as positivity rate for India has fallen below 4%.

We shall be comparing states with 200 or more cases. We shall be using 96%&4% as the weight to calculate COVID Safety index 2nd may onwards as positivity rate for India has fallen below 4%.
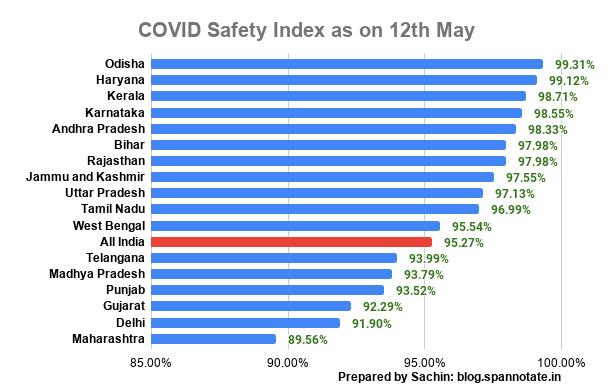
By looking at 12th May COVID Safety index, we can group states in five categories:
- Doing Good: Kerala, Odisha, Haryana, Andhra Pradesh and Karnataka.
- Doing OK: Bihar, Tamil Nadu, Rajasthan, J&K and UP.
- Very Alarming Situation: West Bengal, Telangana, Punjab and MP.
- Situation getting worse: Delhi, Gujarat.
- Maharashtra(very worse!).
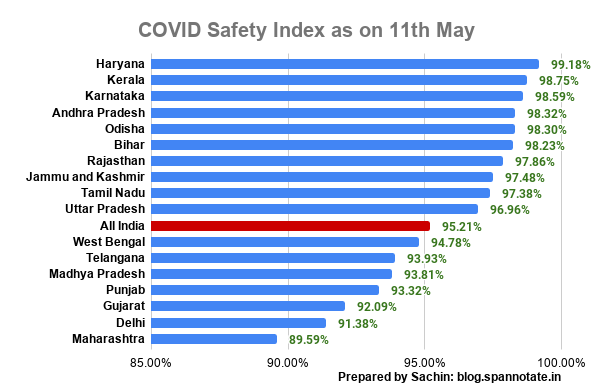
UPDATE: COVID Safety Index as on 11th May
We shall be comparing states with 200 or more cases. We shall be using 96%&4% as the weight to calculate COVID Safety index 2nd may onwards as positivity rate for India has fallen below 4%.
UPDATE: COVID Safety Index as on 9th May
We shall be comparing states with 200 or more cases. We shall be using 96%&4% as the weight to calculate COVID Safety index 2nd may onwards as positivity rate for India has fallen below 4%.

By looking at 9th May COVID Safety index, we can group states in five categories:

We shall be comparing states with 200 or more cases. We shall be using 96%&4% as the weight to calculate COVID Safety index 2nd may onwards as positivity rate for India has fallen below 4%.
UPDATE: COVID Safety Index as on 9th May
We shall be comparing states with 200 or more cases. We shall be using 96%&4% as the weight to calculate COVID Safety index 2nd may onwards as positivity rate for India has fallen below 4%.
By looking at 9th May COVID Safety index, we can group states in five categories:
UPDATE: COVID Safety Index as on 8th May
- Doing Good: Kerala, Odisha, Bihar, Haryana, Andhra Pradesh and Karnataka.
- Doing OK: Tamil Nadu, Rajasthan, J&K and UP.
- Very Alarming Situation: West Bengal, Telangana, Punjab and MP.
- Situation getting worse: Delhi, Gujarat.
- Maharashtra(very worse!).
By looking at 8th May COVID Safety index, we can group states in four categories:
- Doing Good: Kerala, Odisha, Bihar, Haryana, Jharkhand and Karnataka.
- Doing OK: Andhra Pradesh, Tamil Nadu, Rajasthan, J&K and UP.
- Very Alarming Situation: West Bengal, Telangana, Punjab and MP.
- Situation getting worse: Chandigarh, Delhi, Gujarat and Maharashtra(very worse!).
UPDATE: COVID Safety Index as on 6th May
 By looking at 6th May COVID Safety index, we can group states in four categories:

- Doing Good: Kerala, Odisha, Bihar, Haryana, Jharkhand and Karnataka.
- Doing OK: Andhra Pradesh, Tamil Nadu, Rajasthan, J&K and UP.
- Very Alarming Situation: West Bengal, Telangana, Chandigarh, Punjab and MP.
- Situation getting worse: Delhi, Gujarat and Maharashtra(very worse!).
UPDATE: COVID Safety Index as on 4th May

COVID Safety Index as on 30th April
The rank of states based on the COVID safety index as of 30th April can be found below.

One may look at the below table consisting of both the parameters which have been used by us to calculate the COVID Safety Index. ARR(Adjusted Recovery Rate) on 30th April is calculated as a ratio of total recovered cases on 30th April to total confirmed cases on 16th April or the latest available data for the state. We have used data from various state govt portal. There may be a delay or error of 1 day due to lag in reporting on the respective portal.

Haryana, Karnataka, and Tamil Nadu are in the top three states based on the COVID safety index. Kerala and Odisha closely followed them. Delhi, the highest testing rate, has got ranked in bottom three as the HIGH positive rate does indicate that transmission of COVID in Delhi has widespread in patches and is reflected well. The story is almost the same for Maharashtra; COVID has transmitted in various areas of Maharashtra, especially Mumbai. MP(as expected, Govt machinery was not ready from the beginning! ), which does not have a high testing rate, but a high positive rate has put it in the bottom two. Odisha, a sate that does not have enough resources to do extensive testing, has succeeded in keeping a low positive rate among tested by implementing lockdown, tracing more effectively. However, all states are doing sort of fine(if not excellent) as none of them have fallen below 90% in COVID Safety Index. As India has diversity within states, we could make a better judgment if we can calculate COVID Safety index district wise across India, but unfortunately, we don't have data for the same at least not on the public platform. By looking at the index of all the states, it seems a fair comparison(up to a large extent), which indirectly normalizes the size, resources of a state.
COVID Safety Index as on 30th April
The rank of states based on the COVID safety index as of 30th April can be found below.
One may look at the below table consisting of both the parameters which have been used by us to calculate the COVID Safety Index. ARR(Adjusted Recovery Rate) on 30th April is calculated as a ratio of total recovered cases on 30th April to total confirmed cases on 16th April or the latest available data for the state. We have used data from various state govt portal. There may be a delay or error of 1 day due to lag in reporting on the respective portal.